A Picture is Worth A Thousand Words: World War II in Infographics
I have said it here before, and I will doubtless say it again: I hoard collect reference books. There is something about the words “atlas,” “dictionary,” or “encyclopedia” in a title that causes me to stop and take a second look at a remainder table, second hand bookstore or library sale.* I own dictionaries for languages I don’t know, historical atlases for many times and places, an encyclopedia of gods from different cultures, a dictionary of twentieth century culture that I’ve never opened, a book on the principles of statistics that has come in handy more than once, and an odd little volume by Barbara Ann Kipfer titled The Order of Things: How Everything in the World is Organized into Hierarchies, Structures and Pecking Orders that I have turned to more often than I would have thought possible. If pushed to explain, I’ll claim that they are part of my working library. Sometimes it’s even true .
All of which is a long way of saying I was thrilled when a review copy of World War II Infographics landed on my desk several months ago.
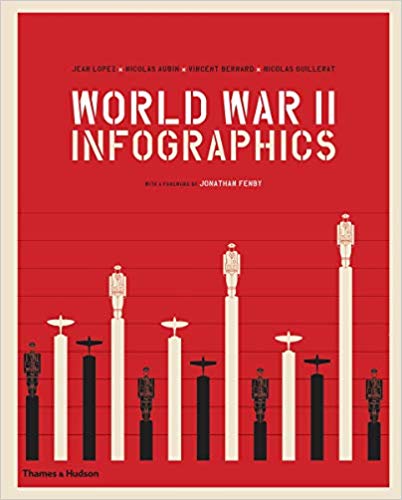
Created by a team of historians and data designers, led by Jean Lopez, the managing editor of Guerres & Histoire (War & History) magazine, World War II Infographics tells the history of that war entirely through well-designed graphics.
World War II Infographics is visually stunning, but this is not a picture book. Its 357 maps and infographs provide a data-rich examination of 53 topics, beginning with the fall of democracies across Europe in the period between the two world wars and ending with unrest and independence in Europe’s colonial empires after the war.
Whether considering aircraft production statistics, Soviet military losses, or desert campaigns in the Sahara, World War II Infographics uses geopolitical, economic, demographic and military data, organizing each topic in ways that ask new questions about familiar information and often provide new answers to familiar questions.
Now if you’ll excuse me, I want to see what I can learn about the RAF bombing of Berlin in 194o. After all, World War II Infographics is part of my working library.
*I have a special fondness for the weird and quirky reference books that don’t survive on standard bookstore shelves
Part of this review previously appeared in Shelf Awareness for Readers.

What a cool hobby!
Some collections happen unintentionally.